Understanding the path users take while shopping online is becoming more and more complex every day, with the growing number of tools, channels, media and opportunities arising. To help businesses and managers understand better what’s going on Google recently launched “The Customer Journey to Online Purchase“, a tool that collects and present in a useful yet simple interface data gathered from more than 36,000 Google Analytics accounts.
The tool is divided into sections and, for each section, it’s possible to refine the selection by country and industry.
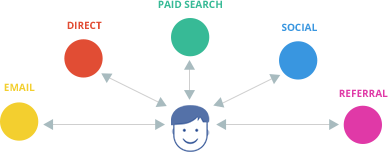
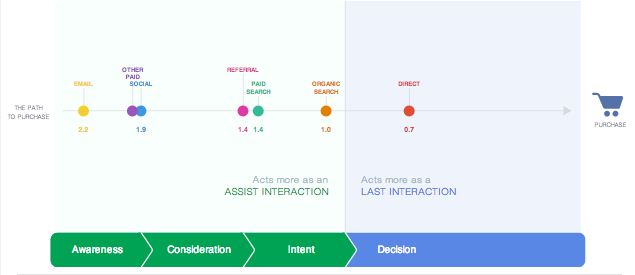
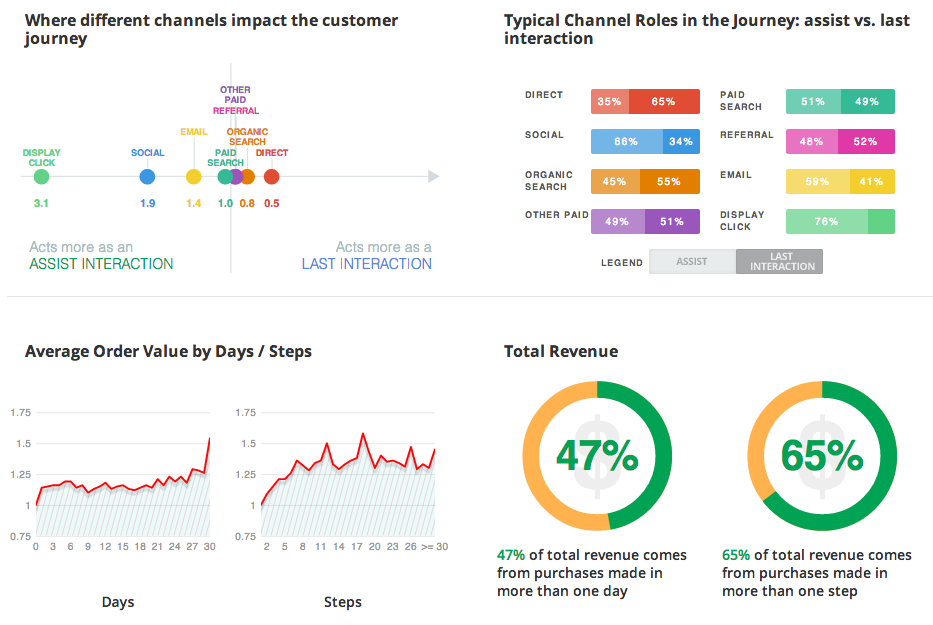
The first section show the differences in customers acquisition role of different channels and can be used to find if there’s some under/overvalued channel, leading to an improvement of the channel mix. The different channels are shown both for customer acquisition and customer support purposes.
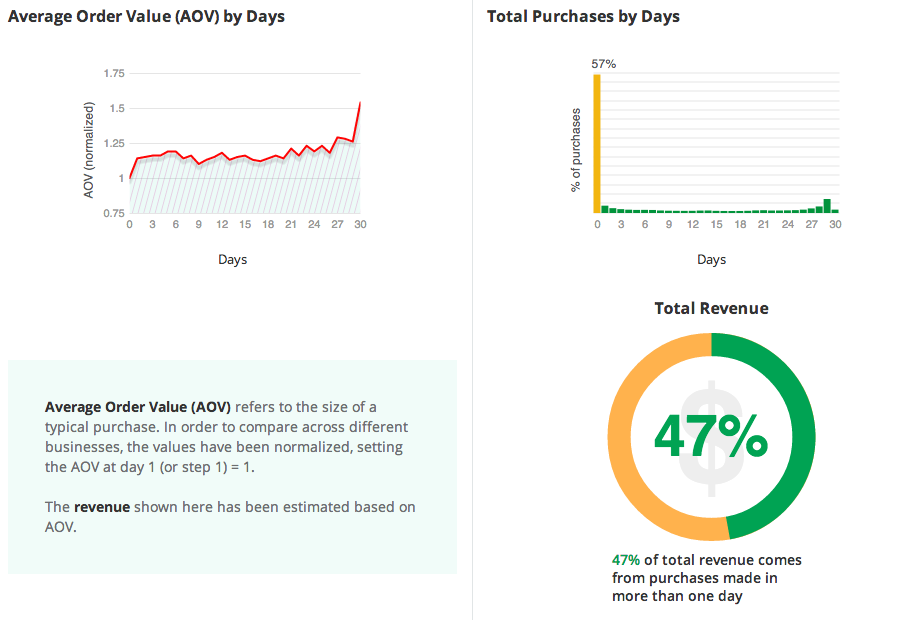
The second section show the duration and the steps taken by users before the actual purchase, as well as the average order value by day.
Finally, the last section is a benchmark dashboard, to help managers see how their company is positioned in respect of the average for the same country/industry combination.
Google has came out with a new, well-designed tool, that’s very useful but should be used with caution: each business has its own peculiarities and only who knows it from the inside can decide what’s right to grow, based on the data he or she is gathering from the current users. A new series of posts will follow on our blog, to describe in more details how to use this tool for different kind of analysis and strategic planning.
Did you know? Vivocha has a built-in Google Analytics integration, to help customers get a better understanding of what’s going on on their websites by providing the necessary dataset for future, more detailed analysis.